Stream Quality
Stream Quality is the per-stream drill-down. Where the Metrics Dashboard tells you which stream to look at, this page tells you what is wrong with it — on the ingress side (the contributor and your transcoder) and on the egress side (delivery to viewers, down to individual sessions).
Open it by clicking a stream on the dashboard's Streams table, or from the Metrics tab of a stream page. The time range selection works the same as everywhere else and carries over from the dashboard.
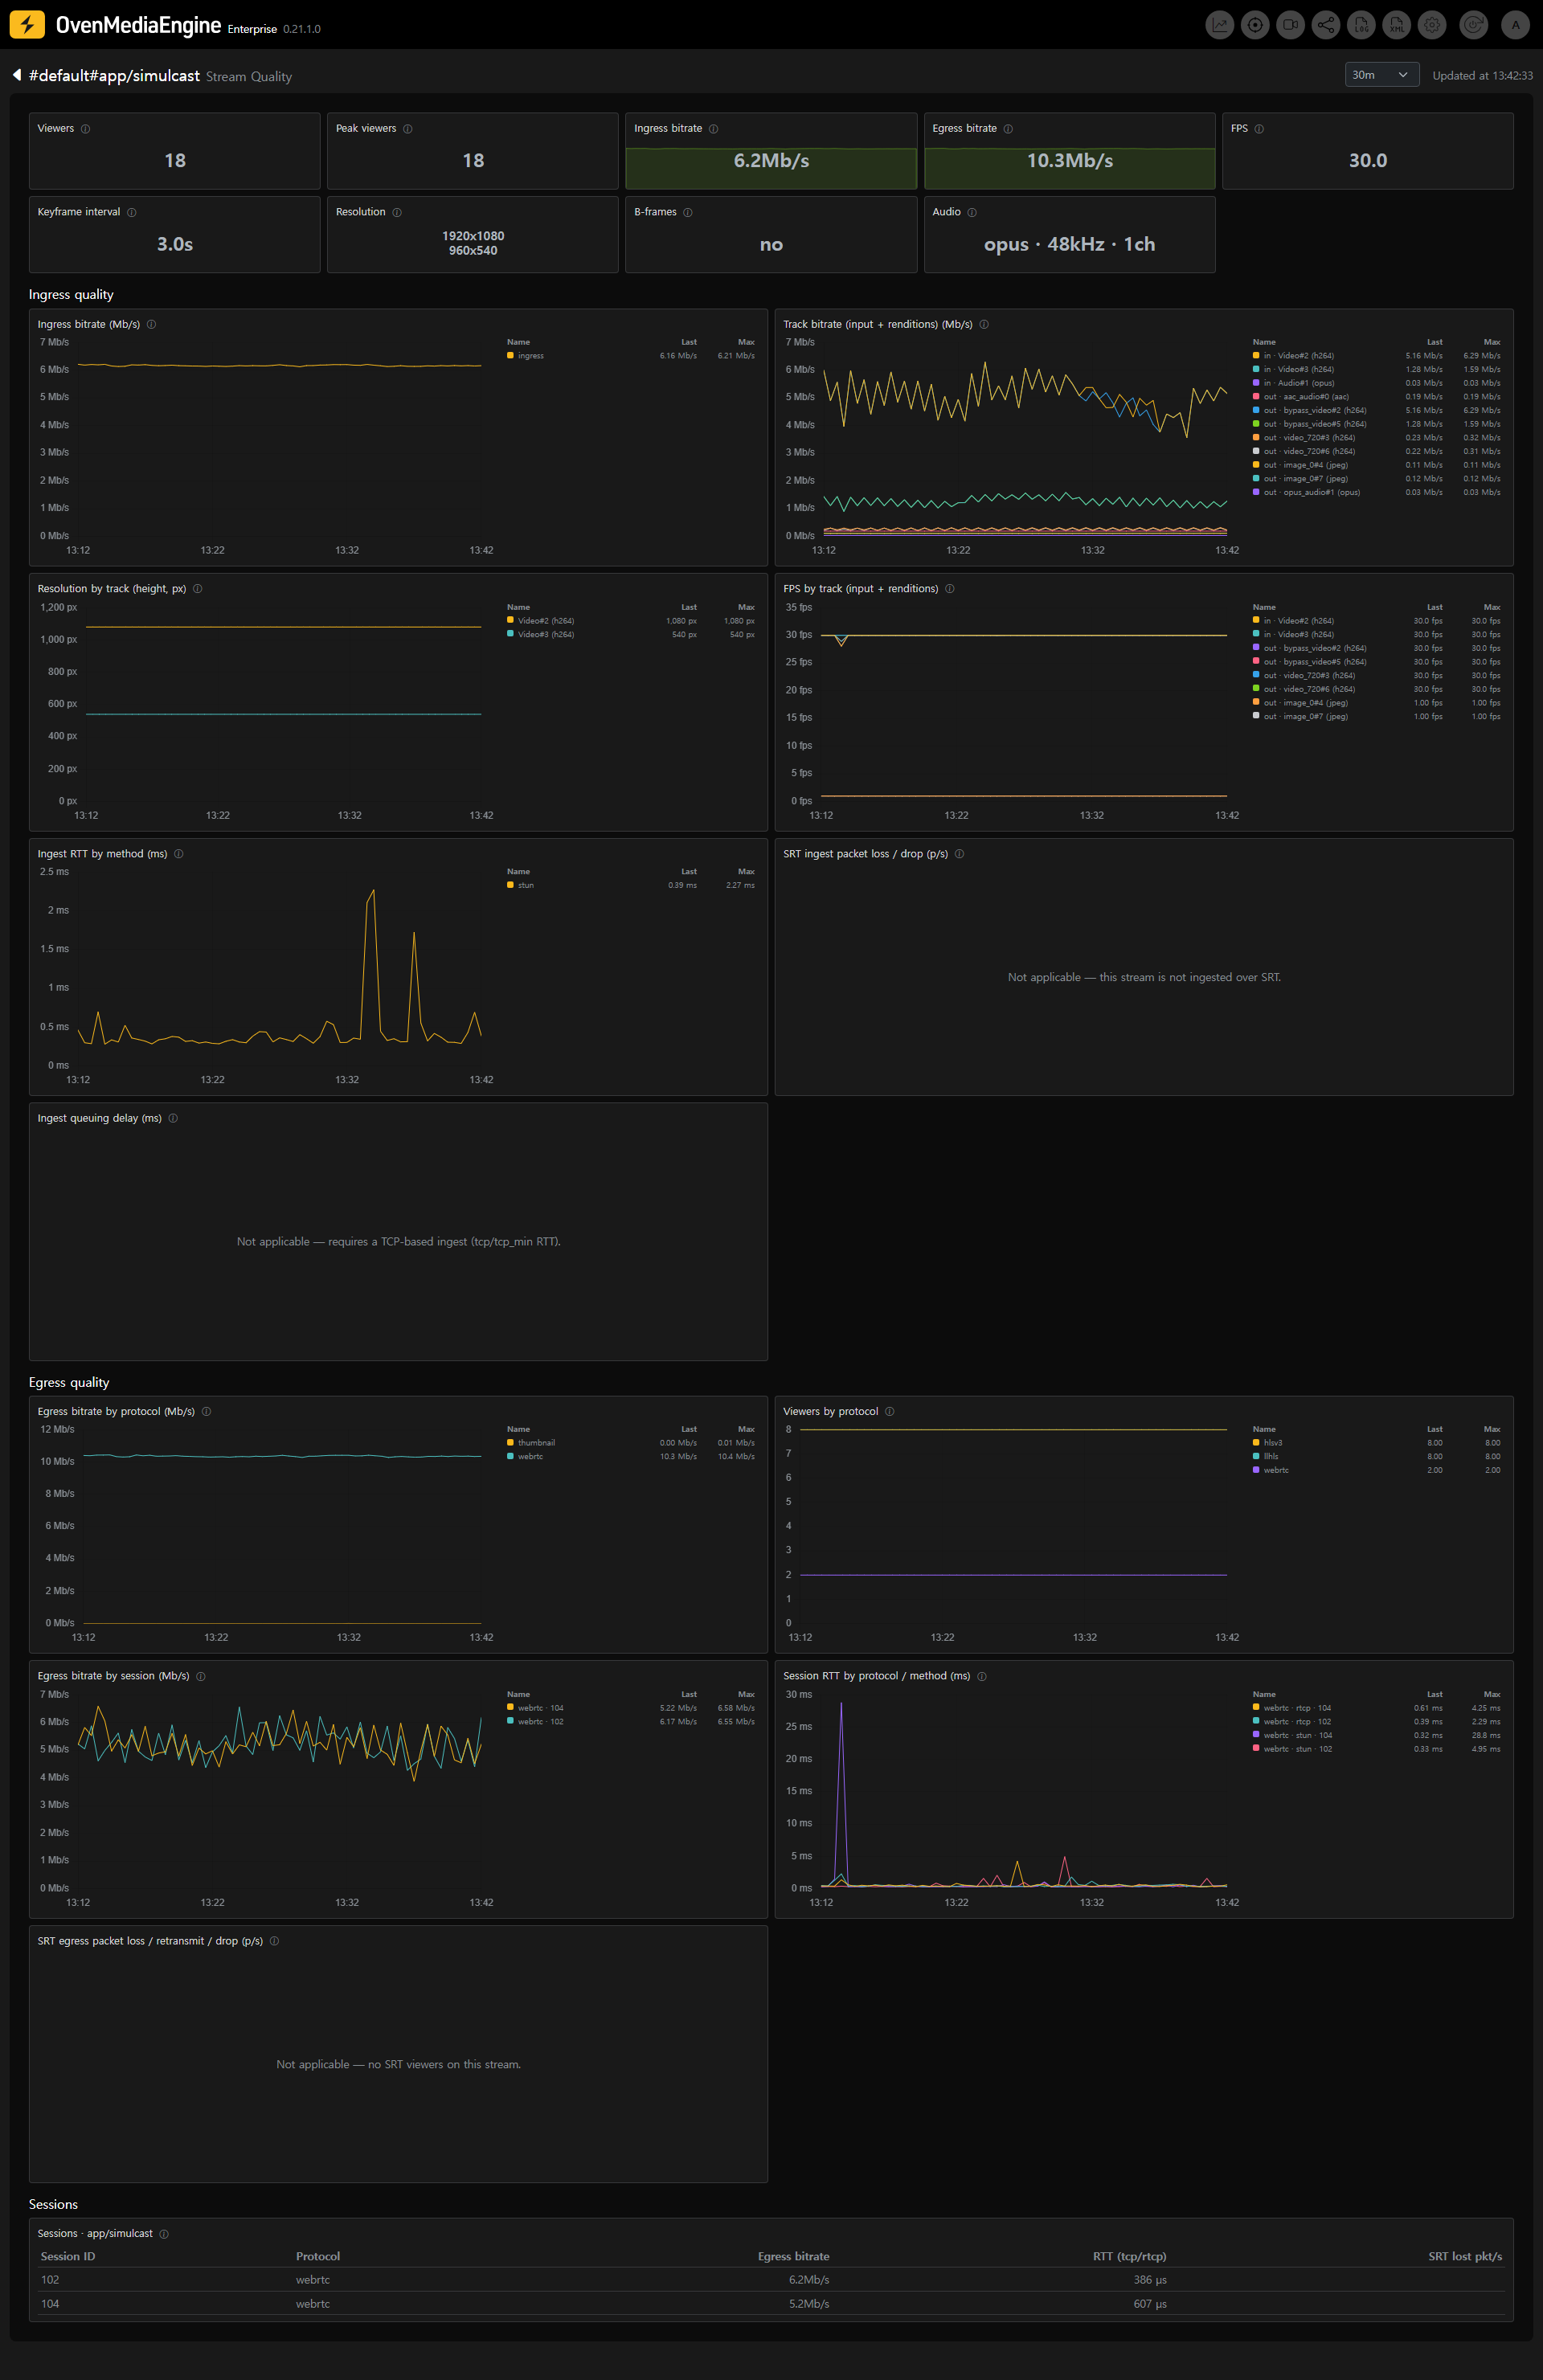
Status chips
The chips are the stream's fact sheet:
- Viewers / Peak viewers — current audience, and the highest concurrency within the range.
- Ingress / Egress bitrate — with background trend lines.
- FPS — measured input frame rate, taken from the lowest video track so one collapsing track cannot hide behind a healthy one. Below ~24 the contributor's encoder is struggling.
- Keyframe interval — in seconds; long intervals slow down player start-up and quality switching.
- Resolution — the exact width×height of the input. A simulcast ingest lists every layer, one per line.
- B-frames — whether the input carries B-frames, which matter for latency-sensitive delivery.
- Audio — codec, sample rate, and channels of the input audio track.
If the stream has ended, a banner shows when it was last seen, and the chips hold their last observed values.
Ingress quality
Is the problem on the contribution side — and if so, is it the contributor's network or this server?
- Ingress bitrate — media received from the contributor. Falling toward zero means the encoder or the ingest link is dying.
- Track bitrate (input + renditions) — every track overlaid. If the input is steady but one rendition drops below its target, the problem is your transcoder (usually CPU), not the network.
- Resolution by track — vertical resolution over time, one line per track. WebRTC/WHIP contributors change resolution dynamically under bandwidth or CPU pressure, so a step down here is the explanation behind "the quality suddenly dropped". Simulcast layers each get their own line.
- FPS by track — measured frame rate per track. WebRTC encoders usually sacrifice frame rate before resolution, so a dip here is the earliest sign of contribution trouble. An input-track dip is the contributor's side; a rendition-only dip while the input is flat is your transcoder falling behind.
- Ingest RTT by method — round-trip time to the contributor.
tcpis what the connection currently experiences,tcp_minis the path's floor: a widening gap between them means data is queuing inside the connection. - SRT ingest packet loss / drop — for SRT ingests.
lostmeasures line quality (SRT recovers these by retransmission);droppedis what viewers actually see — recovery failed. - Ingest queuing delay — delay building up on the ingest connection.
Panels that do not apply to this stream's protocol are marked accordingly.
Egress quality
Are viewers getting the stream cleanly — all of them, or just one?
- Egress bitrate by protocol / Viewers by protocol — which delivery protocols carry this stream, and to how many viewers.
- Egress bitrate by session — the top individual viewer sessions. One session sagging while the rest are flat is that viewer's network, not your server.
- Session RTT by protocol/method — per-session round-trip times.
- SRT egress packet loss / retransmit / drop — for SRT delivery, the same lost-versus-dropped reading as on the ingress side.
Sessions
One row per viewer session (the top 30 by bitrate), with bitrate and RTT side by side — the fastest way to tell "only this viewer is struggling" from "everyone is".
A blank cell means the protocol has no such metric; a 0 is a measured zero. For example, an SRT session's bitrate briefly reading 0 is normal, while LLHLS sessions simply have no per-session RTT.
Applications using <OriginMode> serve LLHLS/HLS viewers from a shared session pool, so those viewers do not appear as individual rows here.
WebRTC, SRT, and OVT sessions always do.
An OVT row is an edge server pulling the stream rather than a viewer, so its bitrate is normally the largest in the list.
The Metrics tab on stream pages
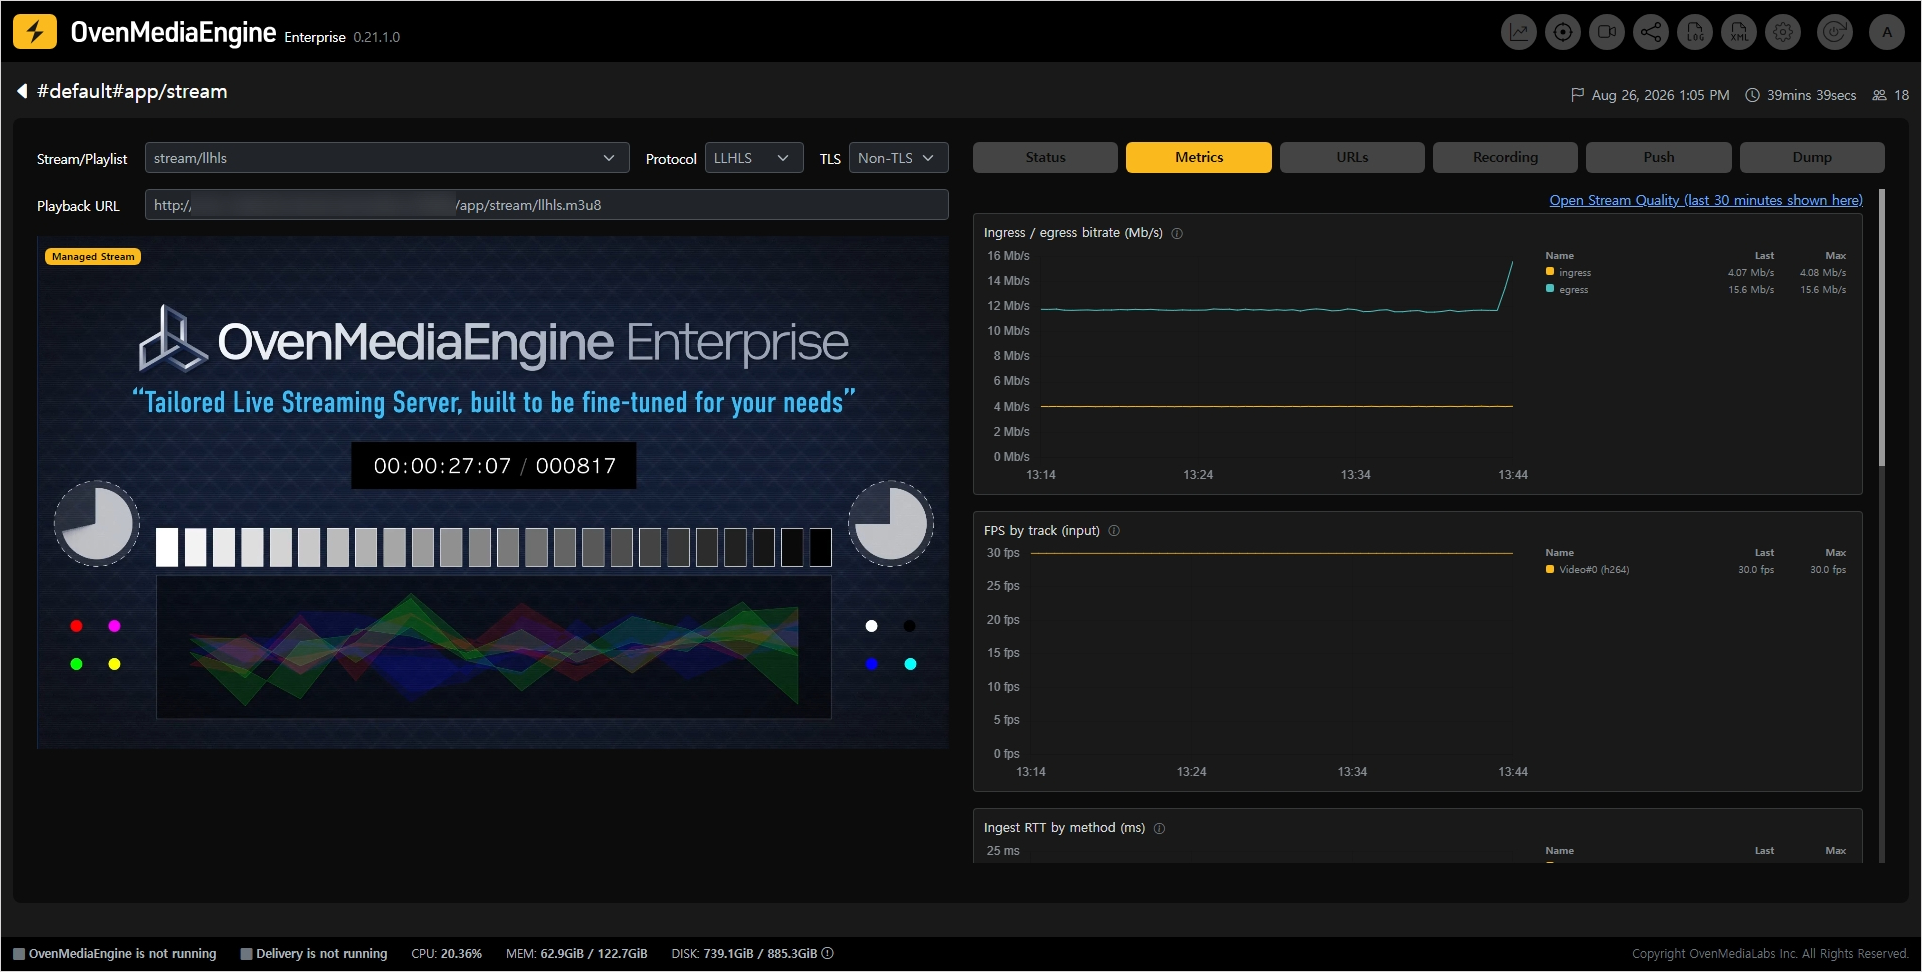
Each stream page also has a compact Metrics tab: the last 30 minutes of this stream's key charts next to the player, refreshed automatically. It is a monitoring companion while you operate the stream — for diagnosis, follow its link to the full Stream Quality page.