
Shipping AV1 in the Real World
Not every device can play AV1 yet. OvenMediaEngine solves this by delivering AV1 and H.264 from a single stream, so each viewer gets the codec their device can actually play.
Step-by-step guides and how-tos.
View All TagsNot every device can play AV1 yet. OvenMediaEngine solves this by delivering AV1 and H.264 from a single stream, so each viewer gets the codec their device can actually play.

What AV1 saves in picture quality and delivery traffic, why live AV1 needs a hardware encoder, and how to configure OvenMediaEngine to turn H.264 ingest into AV1 over LL-HLS and WebRTC.
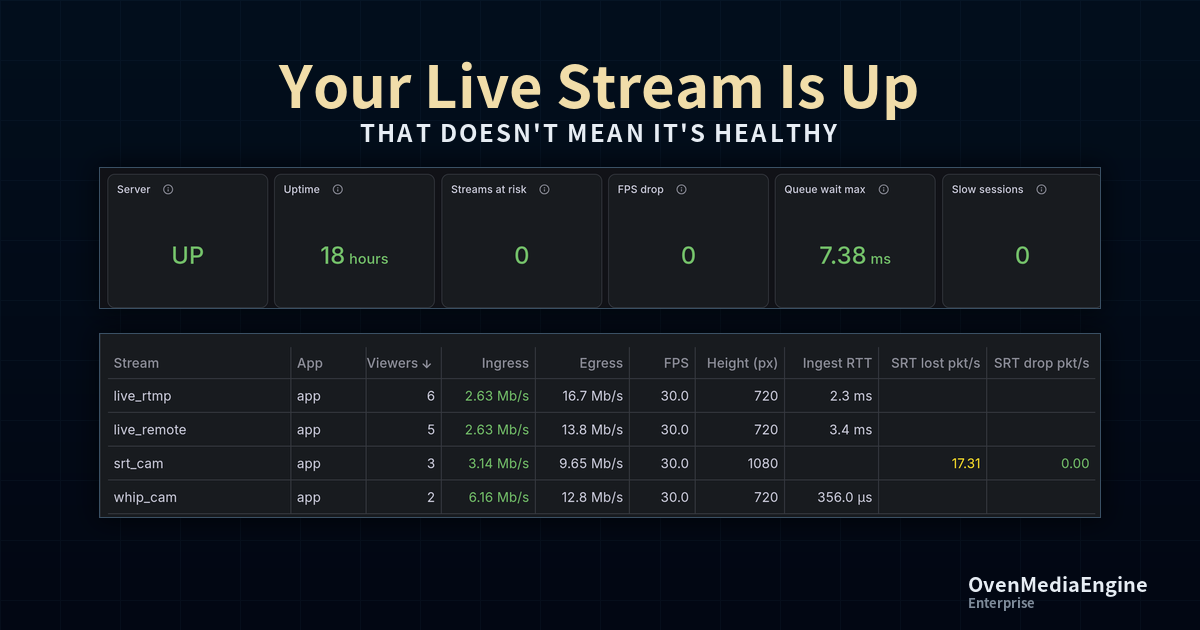
Monitor live stream health with OvenMediaEngine Enterprise, Prometheus, and Grafana. Diagnose ingest issues, transcoding delays, and viewer problems.
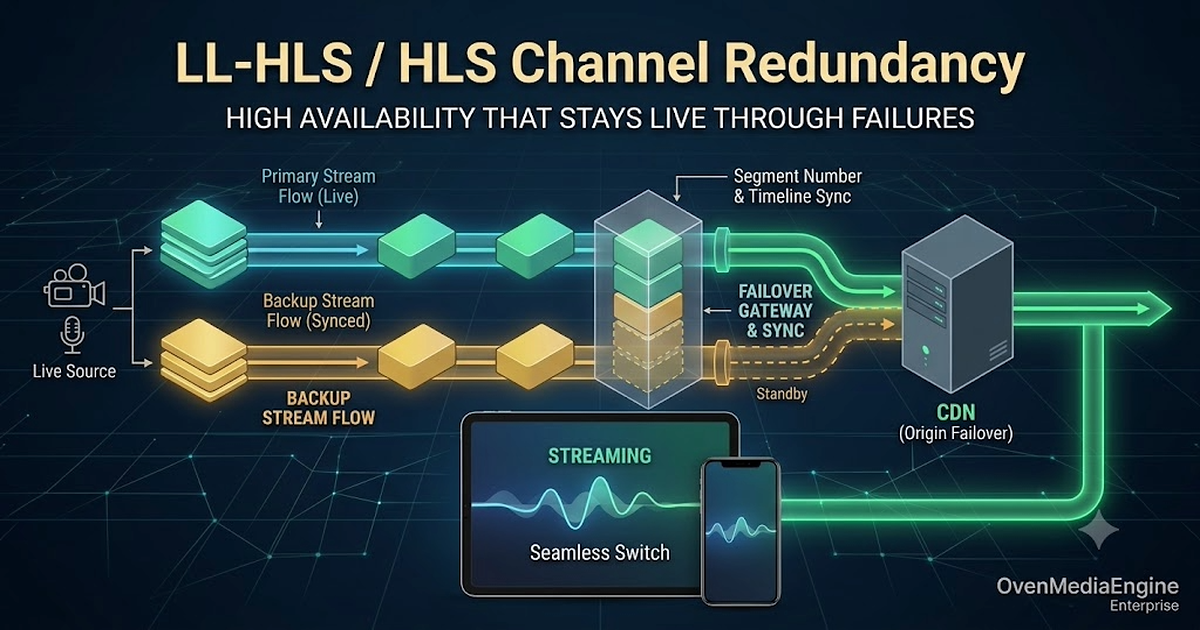
See how OvenMediaEngine Enterprise keeps LL-HLS/HLS streams playing during CDN origin failover with synchronized timelines and segment numbering.
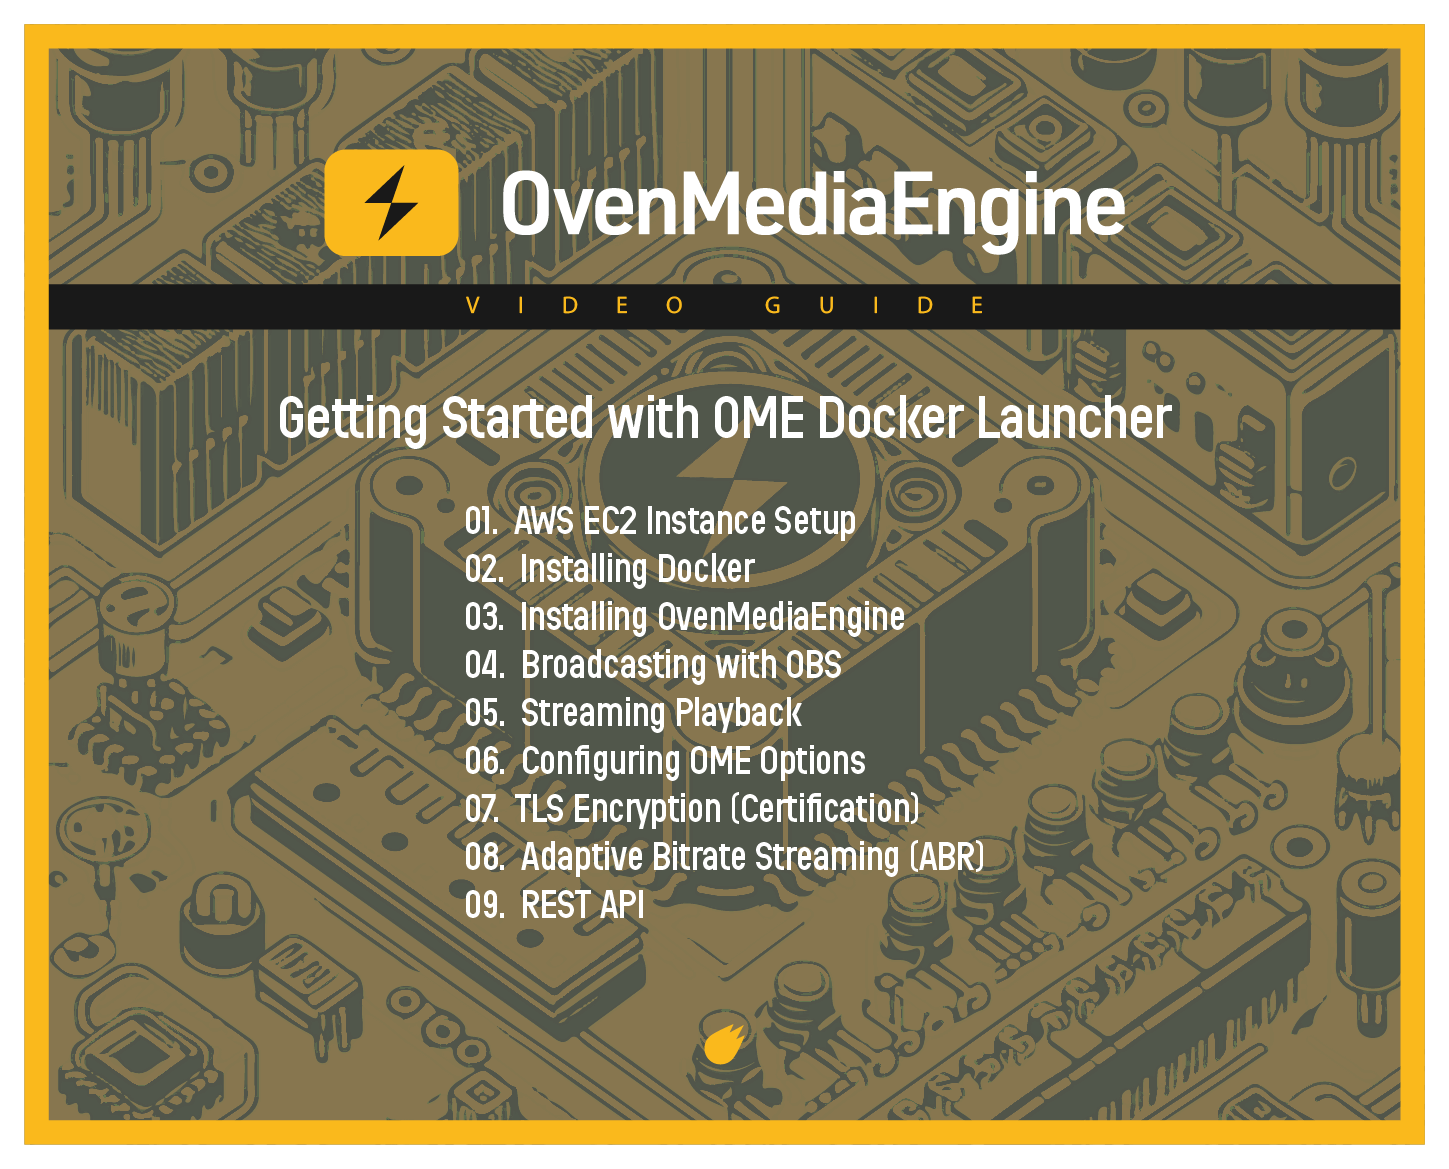
To make this process even smoother, you can minimize the hassle by using our OME Docker Launcher!